Prostate Cancer - PI-RADS v2
Rhiannon van Loenhout, Frank Zijta, Robin Smithuis and Ivo Schoots
Radiology Department of the Haaglanden MC, Alrijne Hospital and Erasmus MC, the Netherlands
Publicationdate
MRI of the prostate has become increasingly popular with the use of multiparametric MRI and the PI-RADS classification.
Multiparametric MRI is a combination of T2-weighted, Diffusion and dynamic contrast-enhanced imaging and is an accurate tool in the detection of clinically significant prostate cancer.
The introduction of the Prostate Imaging Reporting and Data System (PI-RADS) classification for prostate MRI in 2012 lead to a more standardized acquisition, interpretation and reporting of prostate MRI.
Since then, this classification system has been revised and simplified in 2015 and is still evolving, based on data analysis of multiparametric prostate MRI.
PI-RADS version 2
The PI-RADS assessment categories are based on the findings of multiparametric MRI, which is a combination of T2-weighted (T2W), diffusion weighted imaging (DWI) and dynamic contrast-enhanced (DCE) imaging.
Although there is debate about the value of using DCE imaging, it is still included in the PIRADS version 2.0.
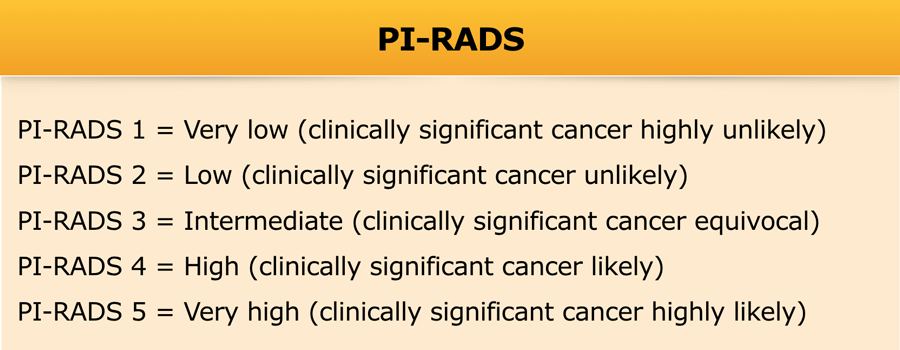
The PI-RADS assessment category determines the likelihood of clinically significant prostate cancer, which is defined as a tumor with a Gleason score of 7 or more.
Gleason score
The Gleason score is used by pathologists to grade prostate cancers.
If the cancer cells and their growth patterns look very abnormal, a grade 5 is assigned. The Gleason score is the sum of the two most prevalent patterns: primary and secondary patterns. However, if there is a worse grade present than the primary pattern (even if it is the third prevalent), this will be graded as secondary.
These 2 grades are added to yield the Gleason score.
The highest Gleason score therefore is 10.
For example, if the Gleason score is written as 3+4=7, it means that most of the tumor is grade 3 and the second most common or most malignant grade is 4.
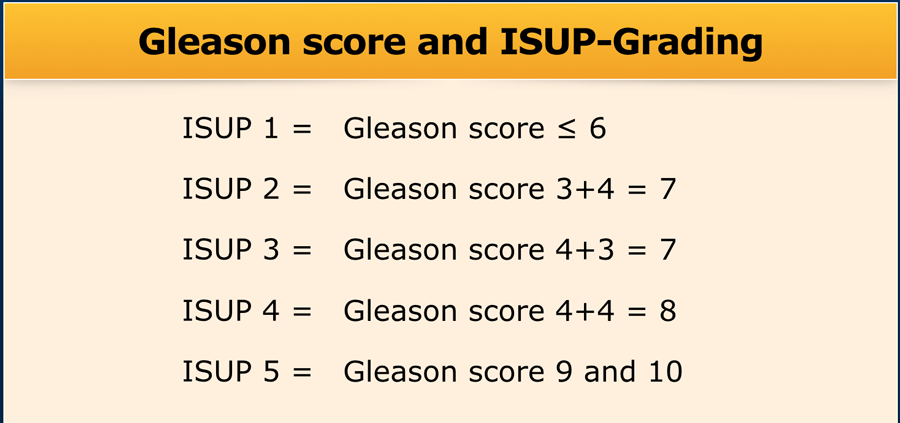
A new pathology grading system was recently proposed by the International Society of Urological Pathology (ISUP), dividing the relevant Gleason scores into 5 Grade Groups to simplify prostate cancer grading (table).
 Click to enlarge image
PI-RADS assessment categories
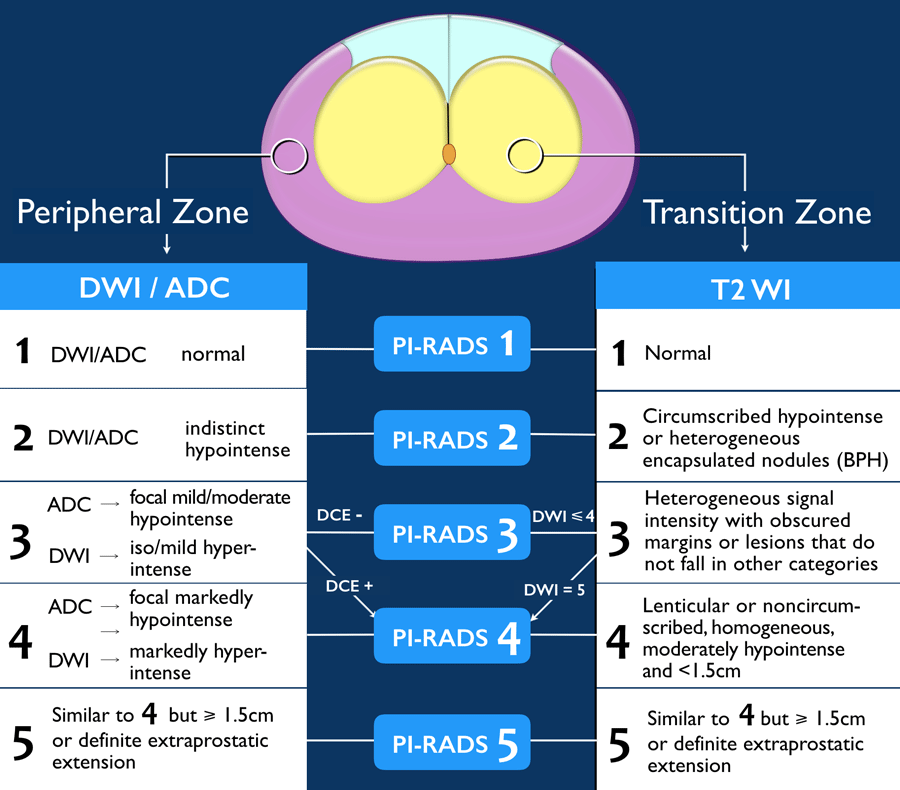
Assignment of a PI-RADS assessment category for each lesion is based on the scoring of T2w, DWI/ADC, and DCE sequences, according to zonal anatomy.
Peripheral zone (PZ)
The peripheral zone is situated on the posterior and lateral side of the prostate, surrounding the transition zone.
For the peripheral zone the DWI/ADC is the primary determining sequence (dominant technique) to assign the PI-RADS assessment category (figure).
Since the dominant sequence for PI-RADS assessment in the peripheral zone is different from the transition zone, identification of the zonal location of a lesion is vital.
Transition zone (TZ)
The transition zone surrounds the prostatic urethra and enlarges in aging men as a result of benign prostatic hyperplasia.
For the transition zone the T2w imaging is the primary determining sequence (dominant technique) to assign the PI-RADS assessment category.
PI-RADS in Peripheral Zone
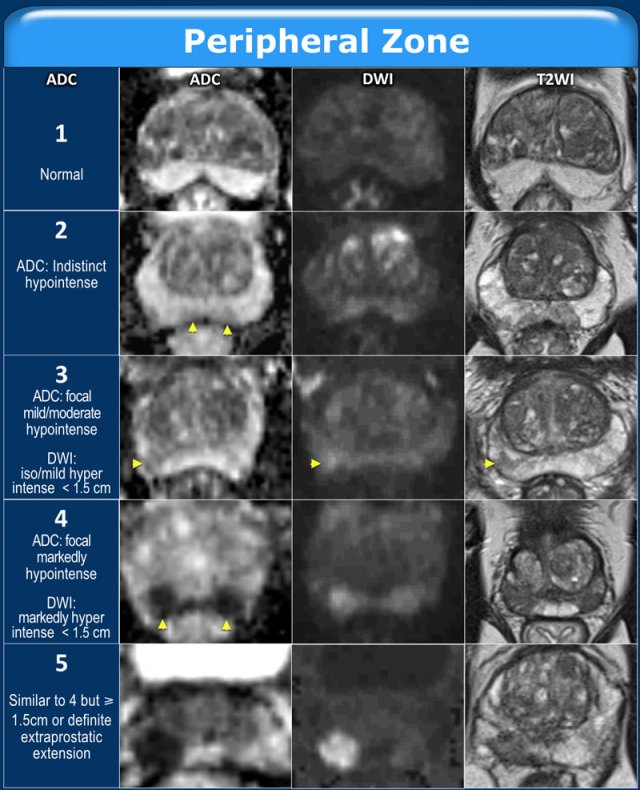
In the peripheral zone, the PI-RADS assessment category of a lesion is determined primarily on DWI/ADC and correlated to T2W-images.
Examples of PI-RADS 1-5 are given in the table.

In the peripheral zone an equivocal lesion (PI-RADS category 3) is assigned to PI-RADS category 4 if DCE is positive, i.e focal or earlier contrast enhancement.
The lesion remains assigned to PI-RADS category 3 if the DCE is negative, i.e. no early enhancement or diffuse enhancement and not corresponding to the focal T2W / DWI lesion or focal enhancement corresponding to BPH.
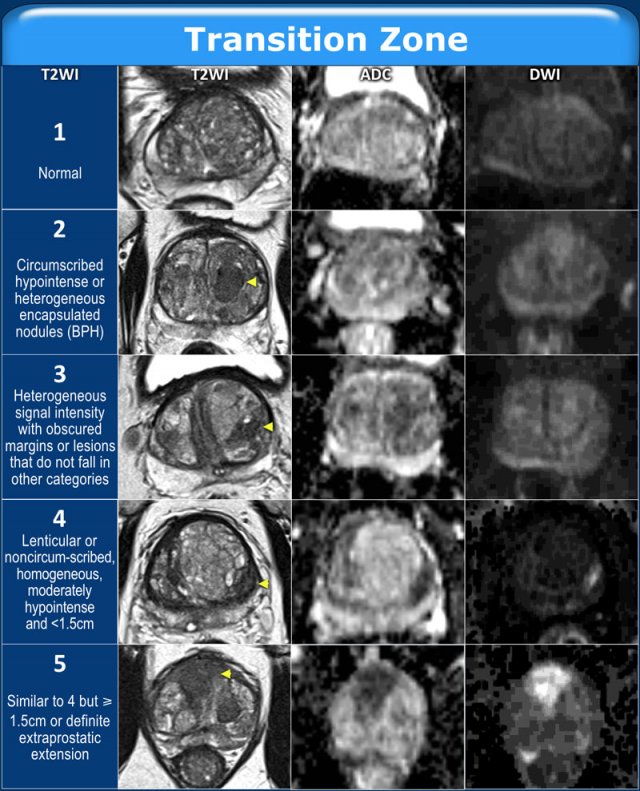
PI-RADS in Transition Zone
In the transition zone, the PI-RADS assessment category of a lesion is determined primarily on T2W-images and correlated to DWI/ADC.
Examples of PI-RADS 1-5 are given in the table.
Click to enlarge the image.
In the transitional zone an equivocal lesion (PI-RADS category 3) is assigned to PI-RADS category 4 if the DWI corresponds with category 5 (markedly intense greater than 1.5cm).
The lesion remains assigned to PI-RADS category 3 if the DWI corresponds to DWI category 4 (markedly intense but less than 1.5cm) or a lower category.
Anatomy

Zonal anatomy
Scroll through the images to see the zones in which the prostate is divided:
- Transition zone surrounds the prostatic urethra.
This zone enlarges in aging men resulting in benign prostatic hyperplasia. - Central zone lies in the base of the prostate behind the transition zone and surrounds the left and the right ejaculatory duct.
- Anterior fibromuscular stroma is a small area of tissue that is situated on the anterior side of the prostate.
- Peripheral zone is situated on the posterior and lateral side of the prostate.
70-75% of all prostate cancers originate in the peripheral zone (PZ).
The posterior aspect of this zone can be examined with digital rectal exam.
25% of prostate cancers originate in the transition zone (TZ).
Very few prostate cancers manifest in the central zone or in the anterior fibromuscular stroma.
Video
The sector map used in the PI-RADS version 2 employs 39 sectors (12 in the base, 12 in the midportion, 12 in the apex of the prostate, 2 seminal vesicles and 1 urethral sphincter).
In this video the zonal and sector anatomy is presented in an animation.

- Base has 6 sectors on each side:
- AS: anterior fibromuscular stroma
- TZ: anterior and posterior transition zone
- PZ: anterior and posterior zone
- CZ: central zone around the ejaculatory ducts
- Midportion also has 6 sectors on each side:
- AS: anterior fibromuscular stroma
- TZ: anterior and posterior transition zone
- PZ: anterior, posteromedial and posterolateral peripheral zone
- Apex also has 6 sectors on each side:
- AS: anterior fibromuscular stroma
- TZ: anterior and posterior transition zone
- PZ: anterior, posteromedial and posterolateral peripheral zone
- Seminal vesicles are divided into left and right
- Urethral sphincter is marked in the prostate apex and along the membranous segment of the urethra.
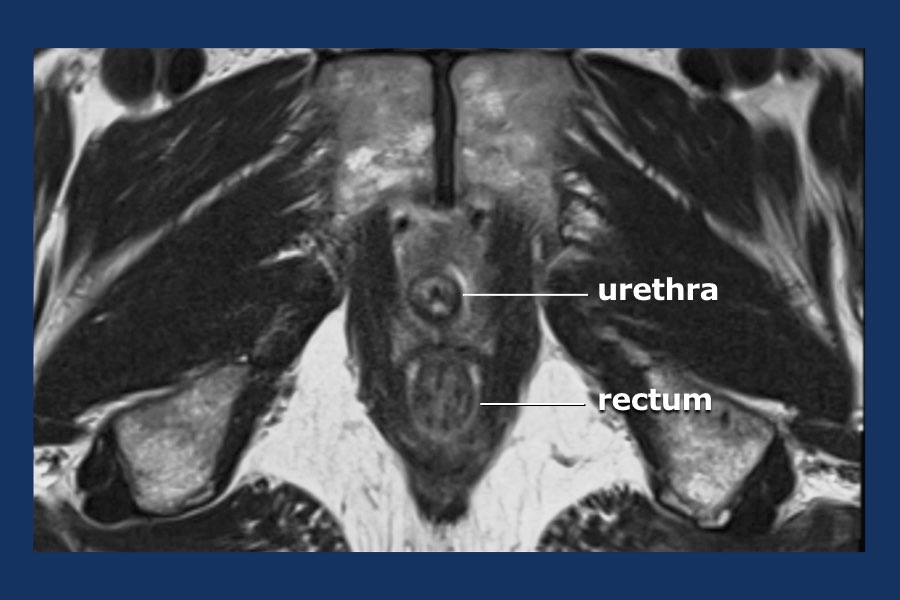
MR anatomy
Scroll through the axial T2 images of a patient with benign hyperplasia of the prostate, which is otherwise normal.
The peripheral zone is a thin layer of homogeneous high signal intensity with a hypointense, well-defined and non-interrupted capsula.
The transition zone typically shows heterogeneity of intermediate signal intensities focally replaced by well-circumscribed hyperplastic nodules of BPH.
The seminal vesicles have a uniform high T2 intensity.
No lymphadenopathy is seen.
Prostate cancer
Peripheral zone
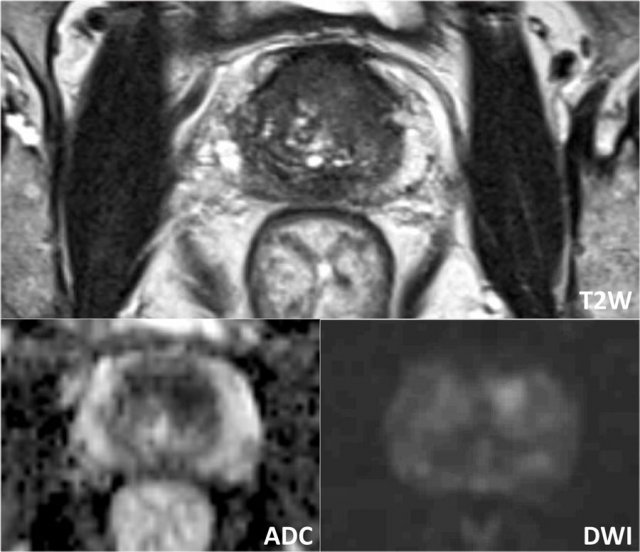
First look at the images and describe what you see.
A 16 mm lesion (measurement not shown) was detected and located dorsally in the peripheral zone of the mid-portion of the prostate on the right.
This lesion was assigned to PI-RADS category 5, based on a 16 mm lesion, markedly hypointense on ADC and markedly hyperintense on DWI (score 5 - dominant sequence), correlated to markedly hypointense on T2W (score 5).
The Gleason score was 3+4, which means intermediate chance for aggressive cancer.
The lesion does not abut the pseudocapsule, and there is no sign of extraprostatic growth.

First look at the images and then continue reading.
The findings are:
- A 17 mm lesion (measurement not shown) is located in the peripheral zone, dorsally on the left in the mid-portion of the prostate.
- It is markedly hypointense on ADC, and markedly hyperintens on DWI.
- It corresponds to a hypointense area on T2W.
- On T2W there is broad-based contact with the capsula.
This lesion was assigned to PI-RADS category 5 with suspicion of extraprostatic extension.
The Gleason score was 4+3.
There is significant restriction in the lesion The ADC measured 440 mm2/s.
This also indicates malignancy.
The actual ADC value is inversely correlated to the likelihood of a clinically significant malignancy.
Values above 900 mm2/s are considered likely benign and below 750 mm2/s likely malignant.
However quantification results may vary substantially between scanners and protocols.
First look at the images and then continue reading.
The findings are (scroll through the images):
- PI-RADS 4 lesion located in the left peripheral zone in the mid-portion of the prostate.
Focal markedly hypointense on ADC (yellow arrow) (score 4), corresponding an hypointense area on T2W (score 4).
The Gleason score of this lesion was 3+4. - PI-RADS 3 lesion is located in the right peripheral zone, with mild focal hypointensity on ADC (green arrow) with isointensity on DWI (score 3).
No DCE was performed and no further discrimination could be determined.
Biopsy did not show any sign of malignancy.
Suspicious lesions in the peripheral zone typically have the following characteristics on T2W-images:
- ill-defined
- hypointense
Less suspicious lesions have the following characteristics on T2W-images:
- bilateral
- symmetric
- diffusely distributed signal changes
- wedge shaped
- sharply demarcated foci of hypointensity

Transition zone
Suspicious lesions typically have the following characteristics:
- non-circumscribed
- homogeneous
- relatively hypointense
- smudged appearance on T2W images, sometimes mentioned as "erased charcoal" appearance.
- lenticular or droplet-like shape
- spiculated margins.
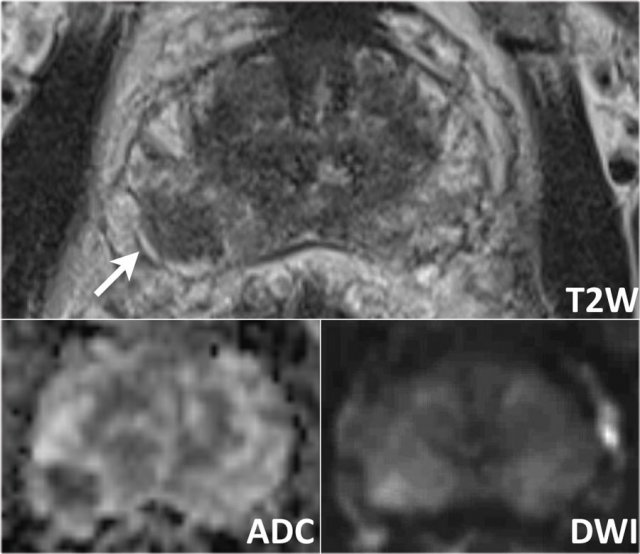
The images show a lesion in the right anterior part of the transition zone.
It has irregular margins on T2W images (score 4) and is focal markedly hypointense on ADC (680 mm/s) (score 4), not exceeding 15 mm in length.
This lesion corresponds to a PI-RADS category 4.
MR/Ultrasound fusion-guided biopsy resulted in a Gleason 3+4.
In the right peripheral zone there is a wedge-shaped slightly hypo-intense area (score 2) without suspicious chracteristics on DWI/ADC (score 2).
It was assigned as PIRADS category 2.
This region is benign (e.g. focal chronic prostatitis)
High-grade tumors often reveal a lower T2W intensity than low-grade tumors.
Extension into the anterior fibromuscular stroma or the urethral sphincter can be seen.
In general, suspicious lesions in the transition zone are frequently challenging to distinguish from the surrounding hyperintense glandular and hypointense stromal tissue.

The images show a PI-RADS 5 lesion located anteriorly in the midline, most likely in the anterior fibromuscular stroma at the junction of the base and the mid-portion of the prostate.
There is no extraprostatic extension.
The lesion has irregular margins on T2W images with an "erased charcoal" appearance, exceeding 15 mm in maximum length (score 5) and is markedly hypointense on ADC (score 5).
MR/Ultrasound fusion-guided biopsy resulted in a Gleason 3+4.
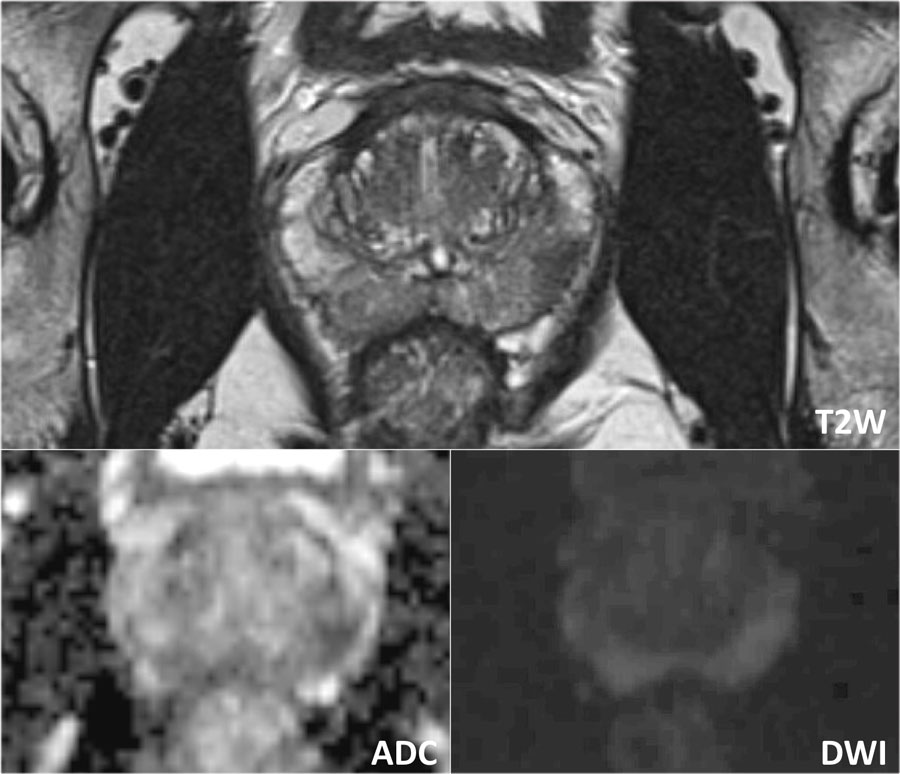
The images show a 27mm lesion anterior in the apex of the transition zone, with an "erased charcoal" appearance.
This corresponds to an area of restricted diffusion with a droplet-shape.
The lesion was scored PIRADS 5.
MR/Ultrasound fusion-guided biopsy resulted in a Gleason 3+4.
TNM-stage
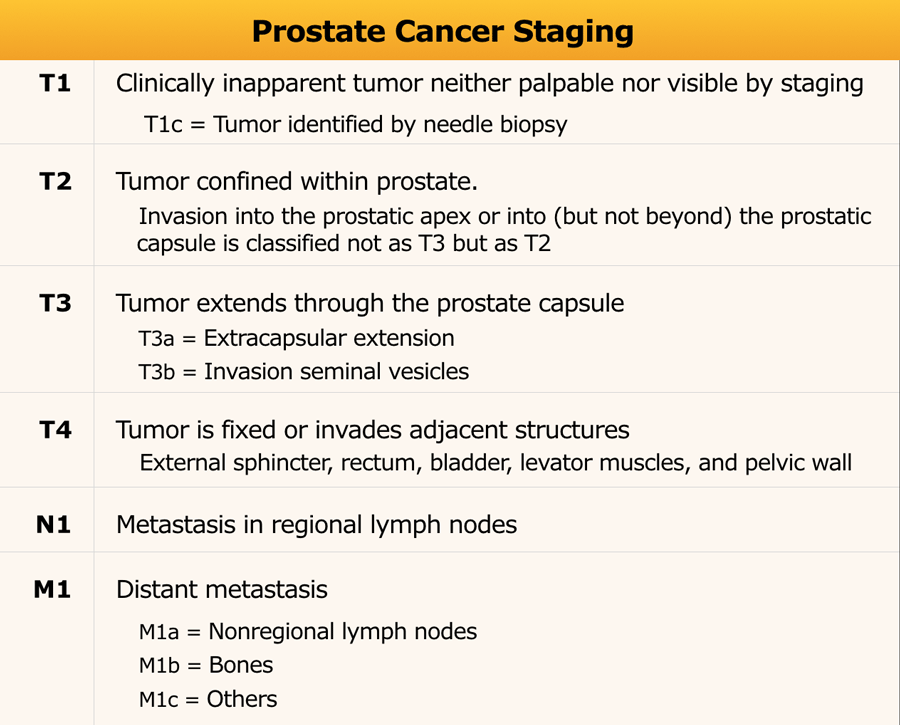
TNM-staging is based on clinical (c) and pathological (p) findings, and if indicated on additional imaging findings.
For T-staging a prostate MRI is advised in:
- intermediate-risk prostate cancer (predominantly Gleason 4 pattern = ISUP ≥3)
- high-risk localized prostate cancer
- locally advanced prostate cancer
Nowadays there is increased utilization of prostate MRI in the primary diagnostic work-up.
The table only shows the stages that are relevant for imaging.
The full table is found here
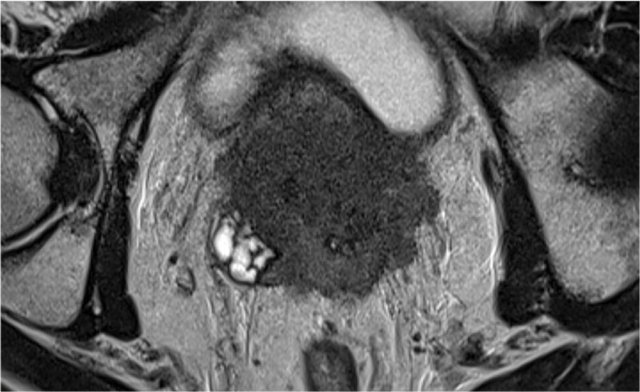 Poorly differentiated adenocarcinoma of the prostate
Locally advanced prostate cancer
The prostate does not have a true capsule.
However on MRI the outer border of the prostate does have a thin, hypointense line, which is histopathologically composed of a fibromuscular band.
This hypointense line can be used to assess extraprostatic tumor growth.
The neurovascular bundles are located at the posterolateral aspect of the prostate (at the 5 and 7 o'clock position)(example on the left).
Involvement of the neurovascular bundle should be specifically reported, as nerve-sparing surgery will be excluded.
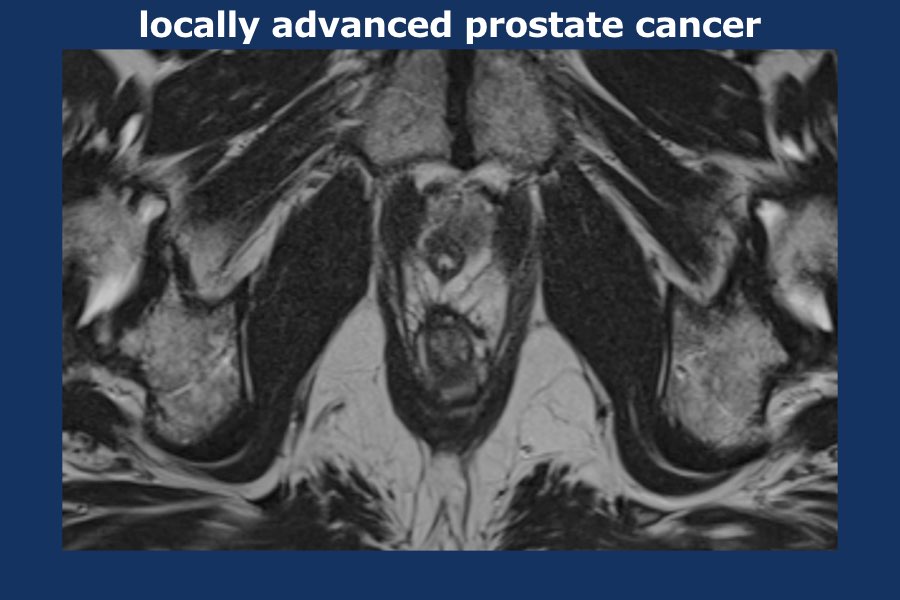
Scroll through the images of locally advanced prostate cancer.
There is a large lobulated tumor originating from the left prostate lobe infiltrating the mesorectum, the rectum as well as the left pelvic wall (i.e. T4).
There are large para-iliac and mesorectal lymphnodes distributed mainly on the left side of the pelvis (i.e. at least N1).
Left prostate needle biopsies proved localization of adenocarcinoma of the prostate.
Gleason score 9 (5 +4), volume percentage estimated 90%.

Here images of a patient with prostate cancer extending into both seminal vescicles.
The axial T2W-image at the level of the prostate base demonstrates low signal intensity replacing the normal signal intensity of the left peripheral zone, with direct tumor extension from the base of the prostate into both seminal vesicles.
Restricted diffusion appears as an area of low signal intensity on the ADC map.
Gleason score: 4+3.
Especially the vascular insertion at both the base and apex are susceptible locations for extraprostatic extension.
Seminal vesicle invasion can be observed by direct tumor extension into the vesicles.
Expansion of the vesicles, focal or diffuse low T2W signal intensity, abnormal contrast enhancement or restricted diffusion can also be features of involvement.
In addition, involvement is likely present when the angle between the prostate base and the vesicle is obliterated.
When the external urethra is involved at the apex, surgical excision can cause sphincter malfunction, resulting in incontinence.

N-stage
DWI is the best sequence for detection of lymph nodes.
T1W series are useful for interpretation of the border contour and signal characteristics of lymph nodes.
MR has a low accuracy for distinguishing positive or negative lymph nodes if characterization is based on size alone.
The following characteristics are considered suspicious:
- round shape and short axis of ≥8mm
- oval shape and short axis of ≥10mm
- heterogeneous appearance
- irregular margins
Regional lymph nodes (green) are below the level of the common iliac junction and are staged N1:
- pelvic
- hypogastric
- sacral
- iliac (internal, external)
Distant lymph nodes (red) are outside these regions and are staged as metastatic disease M1a:
- aortic
- common iliac
- inguinal
- supraclavicular
Benign findings

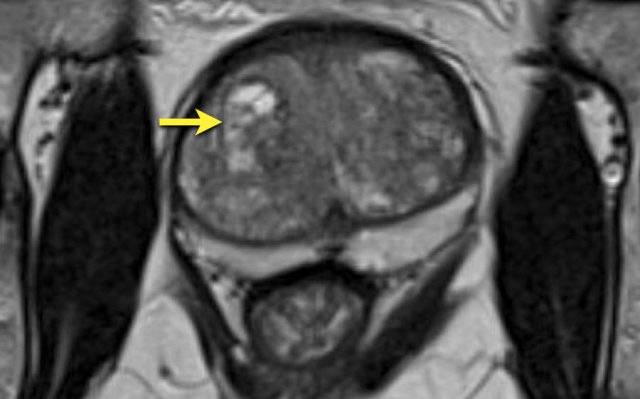
Benign prostate hyperplasia
Benign prostate hyperplasia (BPH) results in the formation of well-circumscribed, encapsulated nodules in the transition zone.
Some of these nodules have dense stroma with low T2W signal intensity and low ADC (yellow arrow).
The left peripheral zone lesion was classified as PI-RADS 5 (red arrow).
MRI- targeted biopsy revealed a Gleason 3+4.
The most important characteristic feature to distinguish BPH nodules from malignancy is the generally well-defined and well-circumscribed morphology interpreted in axial, coronal and sagittal series.
T2 hypointense BPH nodules can be less distinctly circumscribed within the transition zone and may show some degree of restricted diffusion.
Also, these nodules tend to enhance early and intensely on DCE, making conclusive characterization difficult.
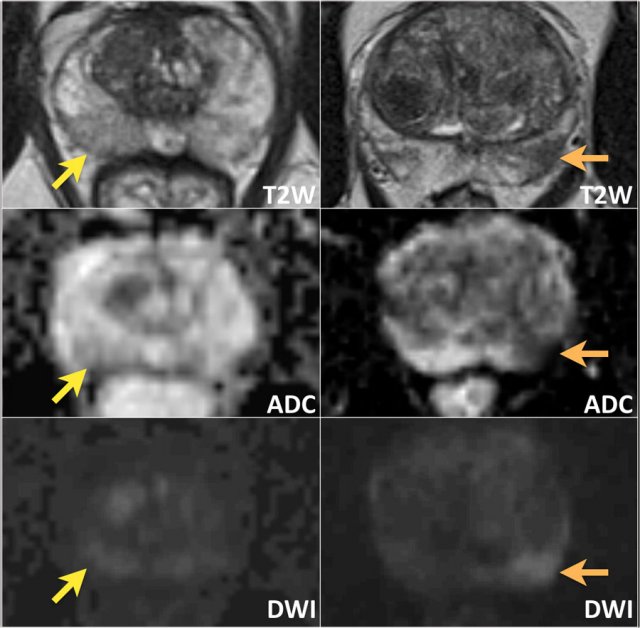
Here a patient with BPH in the transition zone seen as heterogenous stroma with a large cystic area (arrow).
Biopsies showed chronic benign prostatitis.
Prostatitis
Prostatitis is a common finding in men and can occur in the absense of any clinical history or symptoms.
Prostatitis and other benign features like fibrosis, scarring, atrophy and post-biopsy hemorrhage can mimic prostate cancer in the peripheral zone, since all present as a focus of low signal on ADC.
However benign features mostly presents as a band-like or wedge-shaped or diffuse area of low signal intensity, while prostate cancer is more round or droplet-shaped.
The hypointensity on ADC in prostatitis is usually not accompanied by hyperintensity on high b-value DWI series.
Also ADC values in prostate cancer tend to be lower than ADC levels in prostatitis.
On DCE there is increased enhancement, which is therefore not helpful in the differentiation.
In case of chronic inflammation, concordant fibrosis and focal atrophy may be observed, which presents as focal retraction in the normal anatomic convexity of the peripheral zone.
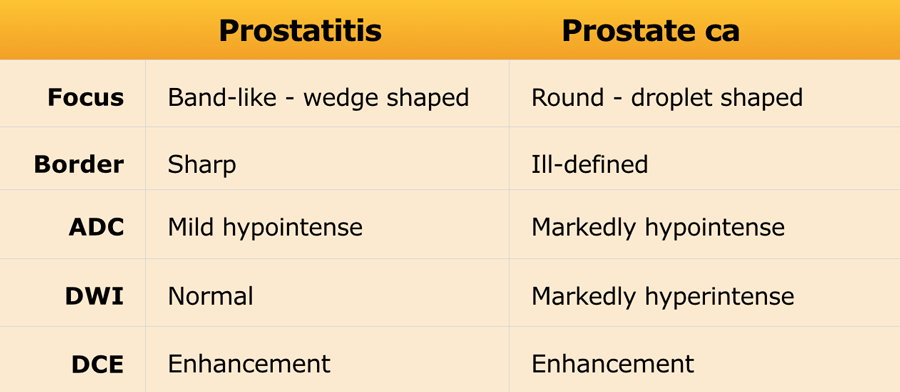
 Differences between prostatitis ( images on the left) and prostate cancer (images on the right)
Here we see the differences between prostatitis ( images on the left) and prostate cancer (images on the right).
Left
The images on the left show a wedge-shaped area of mild hypointensity on T2W and ADC with no concordant high signal on DWI located dorsally in the right peripheral zone of the midportion of the prostate (yellow arrow).
This was interpreted as focal inflammation (PI-RADS category 2).
No biopsy performed.
Right
The images on the right show a clinically significant prostate cancer with an ill-defined zone of markedly hypointensity on T2W and ADC and focal high signal intensity on DWI dorsally in the left peripheral zone (PI-RADS category 4).
MRI-targeted biopsies showed a Gleason score of 4+3.

The images show bilateral wedge-shaped, sharply demarcated hypointense lesions in the peripheral zone with minimal low ADC signal.
These findings can be regarded as benign characteristics, i.e. prostatitis.
Biopsies showed focally some inflammation with glandular hyperplasia.
The T2W-images show a diffusely hypointense peripheral zone.
The ADC does not show any foci of significant low signal intensity.
The DWI is hyperintense on both sides.
The ADC value was 830.
This was interpreted as benign characteristics (PI-RADS category 2) and diagnosed as chronic prostatitis.
Biopsies showed focal chronic active prostatitis and no malignancy.
Prostate volume and PSA density

Prostate volume determines the feasibility of external radiation therapy, which can be performed up to a volume of 55cc.
Please note that this limit is only valid for conventional extern radiation.
For proton radiation this limit don't exist.
PSA density-values of ≥ 0,20 contribute towards the suspicion of a clinically significant prostate malignancy.

In this case the measurements of the prostate are 36 x 50 x 60mm (AP x LR x CC).
This results in a volume of 0,52 x (3,6 x 5,0 x 6,0) = 56,2 cc.
The PSA level in this patient was 5.
The PSA density is 5 : 56,2 = 0,09.
This is a low PSA density and this patient probably has no clinically significant malignancy.
MR-protocol
MR protocol
The axial scan is perpendicular to the rectal wall to reduce partial volume effects at the dorsal borders.
Imaging plane angle, location, and slice thickness for all sequences (T2W, DWI, and DCE) are identical to facilitate correlation and synchronized scrolling.
Spasmolytic agents
Spasmolytic agents can be considered prior to examination to reduce movements of the small and large bowel.
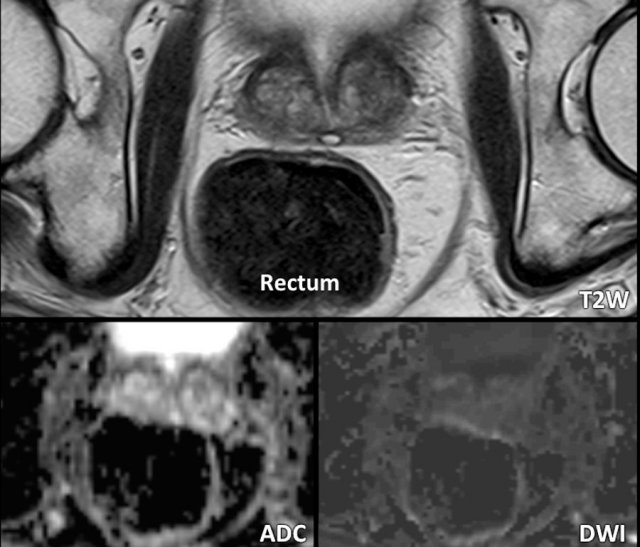
Air and feces within the rectum can impair diffusion assessment.
The images are of a patient who did not receive any preparation prior to the MR-exam.
The presence of air and stool in the rectum induces discrete linear artifactual distortion in the region of the prostate, restricting the diagnostic accuracy of both the DWI and ADC series.

Here an example of a patient who did receive a minimal preparation enema administered a few hours prior to the exam.
This resulted in an evacuated rectum. Although an enema may induce rectal peristalsis, no artifacts were observed in this patient.
T1W
T1W-images determine the presence of post-biopsy hemorrhage.
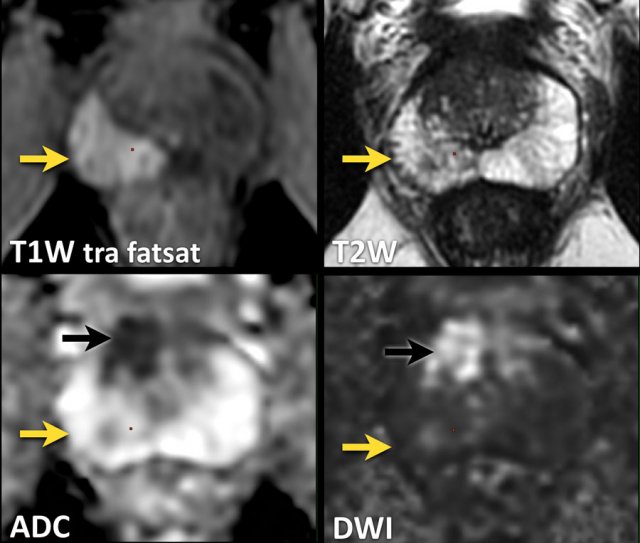
Here images of a patient with a hematoma following systematic TRUS-guided biopsies 3 weeks earlier.
There is high signal intensity on T1W images in the right peripheral zone, with little signal reduction on T2W images, and no restricted diffusion on DWI / ADC (yellow arrow).
Furthermore, a suspicious lesion was identified right anteriorly in the transition zone with low signal intensity on T2W and ADC and high signal intensity on DWI (black arrow).
This lesion showed a Grade Group 3 (Gleason score 4+3) following MRI-targeted biopsy
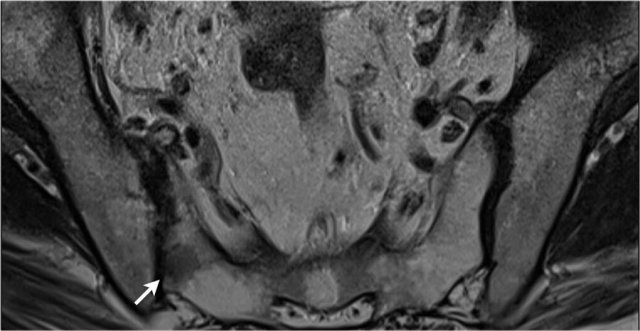
A large FOV up to the aortic bifurcation helps to assess extraperitoneal and pelvic lymph node involvement and osseous metastatic disease (arrow in figure).
T2W
High-resolution T2W FSE sequences are obtained in the axial and sagittal plane.
T2W images show anatomical information on normal and abnormal prostatic tissue.
Additional 3D T2 acquisitions can be used for reconstruction in all three anatomic planes and potential radiotherapeutic purposes.
The video nicely demonstrates the high resolution of the transverse 3D images with coronal and sagittal reconstructions.

DWI
This sequence has to contain both DWI and an ADC map.
Diffusion restriction is present when a lesion with high DWI signal corresponds to low signal on the ADC map, which is highly correlated to malignant cells.
The exact ADC value of the lesion is inversely correlated to the likelyhood of a malignant lesion.
High b-values are necessary to create a high signal-to-noise ratio.
A b-value of at least 1400 is recommended.
Notice the difference between the B1000 and B1400 images.
MR/US fusion guided biopsies of the lesion anterior in the prostate demonstrated Gleason 3+4.
DCE
Dynamic contrast enhancement series are frequently non-specific and the role of DCE in the PI-RADS classification is limited.
Prostate cancer may reveal early and increased enhancement but also normal enhancement compared to normal prostate tissue.
Lack of enhancement does not exclude malignancy, and increased enhancement can be the result of acute or chronic inflammation.
DCE is of aditional value in confirming the suspicious conspicuity of a lesions on T2W and DWI/ADC sequences, and aid in further discrimination in equivocal lesions on T2W and DWI/ADC sequences (see PI-RADS classification).
Timing
Post-biopsy changes, i.e. hemorrhage and inflammation, are usually located in the peripheral zone or the seminal vesicles.
These changes may adversely affect the interpretation of multiparametric MRI whereas signal intensities might be altered.
As these changes tend to diminish over time, an time interval of at least 6 weeks or longer between biopsy and MRI is recommended in the PIRADS guideline.
In current daily practice there is a tendency to perform multiparametric MRI before obtaining biopsies which consequently resolve this issue.
Check list and Reporting

Reporting is done according to the checklist as shown in the table.
Before we start the interpretation of the MRI, we need to be informed about:
- Family history
- Digital rectal examination
- PSA level
- Prior biopsies (quantity, location, Gleason score)
- Prior therapy
In case of multiple suspicious findings, the index lesion is the lesion with the highest PI-RADS assessment category.